
6:05 p.m.
On Wed, Mar 22, 2017 at 7:55 PM, Adam Williamson <adamwill(a)fedoraproject.org
wrote:
Is asking for 'all results for item == X' gonna be too much
work for
rdb to handle? Is that the problem?
Sure could be done that way, the only slight difference is through-output.
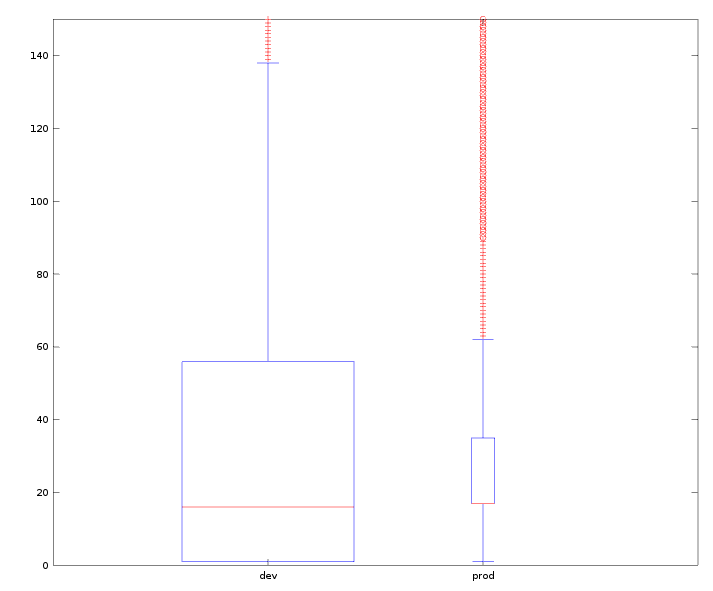
First up, be sure to have a look at the attached graph_data_count.png
representing the number of results per item (Y-axis). tl;dr;
- DEV contains data since 2015-03-18, and has 226428 distinct items
- PROD contains data since2017-01-10, and has 30913 distinct items
- DEV
- median = 16
- max = 16817
- outliers begin at about 140 results per item (cca 7%)
- PROD
- median = 17
- max = 2867
- outliers begin at about 65 results per item (cca 13%)
The bulk of the outliers is composed of depcheck results, taking
gnote-3.17.0-3.fc23 as an example:
testcase_name | count
------------------+-------
dist.rpmlint | 1
dist.depcheck | 16287
dist.upgradepath | 21
Let's get some stats going on.. I did some tests on DEV by timing various
parts of the process of querying data.(inside RedHat, outside Infra),
removing the outlier times to crop the IO bound problems with DB (at the
moment the DB server a bit overloaded, and data are routinely swapped in
and out of memory, thus creating order of magnitude delays for non-cahed
data). Roundtrip for a databse-disconnected, almost empty result <
http://taskotron-dev.fedoraproject.org/resultsdb_api/api/v2.0/> is about
500 ms, this time will most probably be better for Bodhi, as it is in the
same datacenter (I would think), so take the 'roundtrip' times with that in
mind
The times are split as such:
- database ~ the time to get the results from database (read the notes
section below)
- serialization ~ the time it takes to produce the serialized data (dict
to be jsonified) based on the data from database
- jsonify ~ the time it takes to jsonify the prepared dict
- server ~ sum of all the above
- roundtrip ~ time it took to get the data
All the test queries were run 25 times, first 5 were discarded (to force
the data in question into memory on the DB machine) and the times are
averaged.
= 20 results (median)=
`curl "http://taskotron-dev.fedoraproject.org/resultsdb_
api/api/v2.0/results?item=hplip-3.16.7-3.fc25&limit=20" -s /tmp/datafile`
"database":
0.0072879791259765625,
"jsonify": 0.0033910274505615234,
"serialization": 0.19698095321655273,
"server": 0.20765995979309082,
"roundtrip": 0.935
= 55 results (3rd quartile) =
`curl "http://taskotron-dev.fedoraproject.org/resultsdb_
api/api/v2.0/results?item=dolphin-15.12.3-1.fc24&limit=55" -s >
/tmp/datafile`
``
"database": 0.007297039031982422,
"jsonify": 0.008601188659667969,
"serialization": 0.4342458248138428,
"server": 0.45014405250549316,
"roundtrip": 1.547
= 140 results (data without outliers) =
`curl "http://taskotron-dev.fedoraproject.org/resultsdb_
api/api/v2.0/results?item=moodle-3.0.4-1.fc24&limit=140&callback=timeit" -s
/tmp/datafile`
"database": 0.015254974365234375,
"jsonify": 0.022364139556884766,
"serialization": 1.390178918838501,
"server": 1.4277980327606201,
"roundtrip": 3.020
= Notes =
== database vs. serializatoin times ==
The `databse` tiime does not account for loading the extra data, testcase
and group information, that is in the `serialization` time. This is mostly
due to the fact that I was not able to force the sqlalchemy to load all the
related data at once, to be able to profile the actual process of
serialization separately. The queries performed there are all only direct
index searches over numerical id, but three of them are performed per
result. If the webapp-database roundtrip takes noticeable amount of time
(and my gut feeling would be that they are not insignificant) , finding a
way to load the data all at once might help with the time, at the cost of
higher memory consumption. But the time to grab the 'raw' results is still
informative, as it shows the base time to even get the process started.
== DB IO ==
As I said earlier, these are the bestcase scenarios - most of the time, you
(Bodhi) won't be doing that N-th same query to get that benefit of having
data in memory, but the data will need to be loaded from the disk. This is
something Tim and I want to get sorted out (by splitting the various
databases from the one machine that currently handles them all). But as
this will be the "common" expected experience, consider the "slow"
times
for those same queries:
20 results:
"database": 0.19269204139709473,
"jsonify": 0.003347158432006836,
"serialization": 0.5247390270233154,
"server": 0.720778226852417
55 results:
"database": 0.2362060546875,
"jsonify": 0.008295059204101562,
"serialization": 0.8430919647216797,
"server": 1.0875930786132812
140 results:
"database": 0.013692140579223633,
"jsonify": 0.02150702476501465,
"serialization": 2.1643788814544678,
"server": 2.199578046798706
= Conclusion =
== Regarding ResultsDB ==
I will profile the serialization code itself, and investigate on a way to
force less sql queries so we can compare the results. My gut feeling is
that we could lower the "best" time focusing on these aspects
The actual problem, that needs solving though, is moving the resultsdb
production DB to a separate machine to get rid of that IO bound problems.
These cause/will cause the actual slowdown that can be observed by querying
ther resultsdb in the semi-random way bodhi does/will be doing.
== Regarding the Bodhi endpoint/middleware optimization ==
I'm not sure it is worth doing _right now_ but given the nature of what it
would do, and the way it would be implemented, there would be measurable
spead-up in the DB-part, as the database would be optimized for this one
specific use-case. It would also lower the Bodhi load, since the
de-duplication would be taken care of there, instead of in the consumer.
I still believe, that having designated DB server for resultsdb prod and
exploring the loading process will have bigger impact, but I can not take
care of the first part on my own.
Did this help to answer your questions?
Josef